As I delved into the intricacies of audio engineering, I stumbled upon something fascinating – the Fletcher-Munson curve.
At first glance, its serpentine shape might seem somewhat daunting or confusing, but this curve holds some remarkable truths about our perception of sound.
Despite the complex title, the Fletcher-Munson Curve is a captivating audiology concept that reveals insights about human hearing.
Named after two brilliant figures, Harvey Fletcher and Wilden Munson, who studied under Bell Laboratories in the 1930s, these curves reflect how we perceive varying loudness levels at different frequencies.
From music producers to audiophiles and those curious about sound, understanding this concept can unexpectedly enrich our interaction with audio.
What is the Fletcher-Munson Curve?
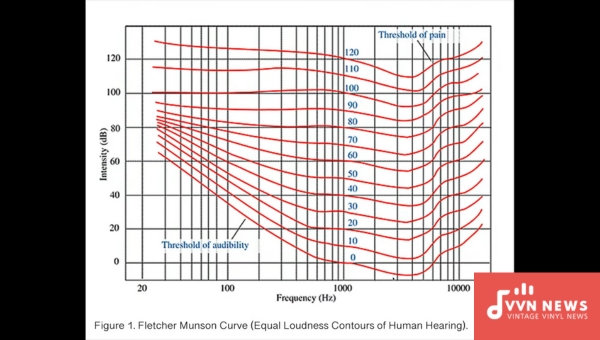
The Fletcher-Munson Curve, also known as the Equal-Loudness Contour, is a graph that illustrates the relationship between sound levels and frequencies and how the human ear perceives them. Harvey Fletcher and Wilden A. Munson developed it in the 1930s.
According to this curve, our perception of sound frequency varies with volume levels, meaning we hear specific frequencies as louder even if they’re played at the same volume as others.
This phenomenon is critical for audio engineers in designing sound systems for optimal listening experiences.
Fletcher-Munson Curve: Its Role and Importance
It has immense significance in several fields associated with sound manipulation and perception, and it is equally important for everyone, from an everyday music enthusiast to a professional sound engineer.
Understanding Human Perception Of Sound
One of the core functions of the Fletcher-Munson Curve is in the realm of human psychoacoustics.
It helps us understand how humans perceive various frequencies at different loudness levels.
But, how loud a specific frequency must be perceived as equally loud to others.
Significance in Audio Engineering
For music producers, understanding the curve is crucial during the recording, mixing, and mastering stages.
Often, specific frequencies don’t appear as loud as they should due to our different sensitivities to different frequencies.
This can affect how the listener perceives an audio output, and this curve is handy.
Useful in Designing Audio Equipments
Fletcher-Munson Curves guides designers while developing efficient musical instruments and audio equipment like headphones or speakers.
Importance in Communication Devices
The curves are used to enhance intelligibility in communication devices. By knowing which frequencies humans hear best, these devices can be designed for optimal efficiency.
Understanding Fletcher-Munson curves can enhance our interaction with sound and aid us towards a better aural appreciation, making it vital for professionals and any person dealing with sounds or music regularly.
Also Read: What Is Programme Music? [Exploring Narrative In Symphony]
The History and Concept Behind the Fletcher-Munson Curve
Let’s take a quick step back to the mid-20th century when two intrepid pioneers of audio, Harvey Fletcher and Wilden A.
Munson began their foray into how humans perceive sound. Working under Bell Laboratories in the 1930s, they conducted a ground-breaking experiment that would go on to create a cornerstone of audio engineering – the Fletcher-Munson Curve.
History – The Experimental Triumph
In their historical study, Fletcher and Munson had subjects listen to pure tone signals at frequencies ranging from low (e.g., 20 Hz) to high (e.g., 16 kHz).
To find out at what level each frequency would be perceived as equally loud to all other frequencies.
They documented these measurements in Phons, a unit for perceived loudness.
Each point that stood equal in loudness was connected across all frequencies, creating curves representing various loudness levels (measured in decibels). And thus, the iconic curves were born.
Understanding the Intricacies
The Fletcher-Munson Curves, also called equal-loudness contour curves at times, reflect an intriguing aspect of human hearing – the perception of loudness is frequency dependent.
This implies that our ears perceive different frequencies (tones) differently at various volume levels (loudnesses).
For instance, if we take a tone at 1kHz as the reference point, our ears will perceive tones with lower or higher frequencies to be softer at the same physical volume level.
Let’s simplify – Suppose we listen to two tones; one is playing at 1 kHz and another at 50 Hz.
Even if both are being played back at the same physical volume level (dB SPL), the tone at 50 Hz may seem quieter to us.
It means that to perceive the 50 Hz tone as loud as the 1 kHz one, we may have to increase its volume level (dB SPL).
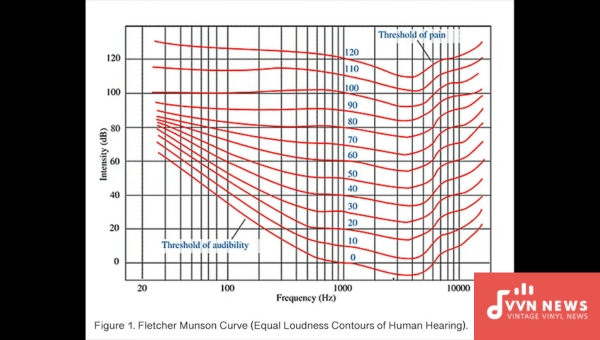
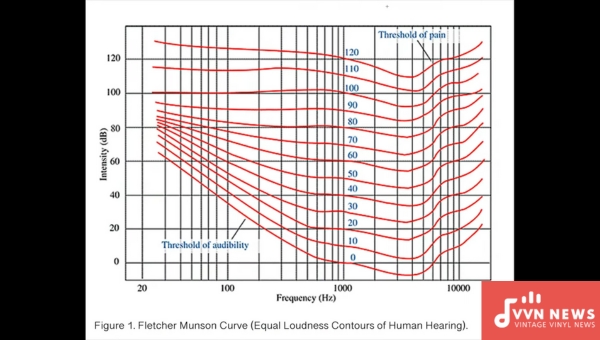
The representation of this phenomenon is captured in these curves plotted against two axes – the y-axis for ‘Loudness Level’ (Phon) and the x-axis for ‘Frequency’ (Hz).
Along these curves, various points show equal loudness perception across different frequencies.
By studying these curves closely, one can understand how our hearing mechanism influences our perception of sound.
Charting a path through history and revolutionizing the audiology world, Fletcher and Munson gave us an insightful tool to comprehend and calibrate audio experiences suited for human hearing.
Their trajectory-breaking work continues to shape soundscapes around us and undoubtedly forms an integral part of any audio-related discourse.
Also Read: What Is Audio Clipping? [Digital Clipping Vs Analog Clipping]
Detailed Explanation of How to Construct a Fletcher-Munson Curve

The Fletcher-Munson Curve, or the equal-loudness contour curves, are intricate yet intriguing.
Learning how to construct them might seem like an uphill task initially, but once you fully grasp its fundamental aspects, the process becomes relatively straightforward.
Here’s a step-by-step guide on how to construct these curves:
Establish the Vertical and Horizontal Axis
Lay out a graph with two axes. The horizontal axis represents frequency (measured in hertz) and should span about 20Hz to 20kHz, reflecting the standard range of human hearing.
The vertical axis denotes perceived loudness (in phons), ranging from 0 at the bottom (the softest sounds we can hear) upwards based on your focus area.
Mark the Threshold of Hearing and Threshold of Pain
The hearing threshold is the softest level humans can hear at each frequency, represented by the curve that lies along the bottom of your graph.
At the top end will be the pain threshold, where sound levels become painfully loud.
Plot Equal-Loudness Contours
Each line between these thresholds illustrates equal loudness contours (i.e., Fletcher-Munson Curves).
These curves show how loud various frequencies must be to sound equally loud naturally.
They start in the low frequencies where our ears are less sensitive and rise towards about 3kHz – where we’re most susceptible, before dropping again.
Indicate the Phon Levels
The phon level—represented by each curve—is traditionally marked in 10 dB increments, starting from the bottom curve (0 phon).
As you move upwards, each curve represents a louder perceived sound.
Understanding that these curves are the average values derived from various experiments and might not perfectly represent one’s sensory perception is essential.
They serve as an effective model for understanding essential aspects of human auditory mechanisms.
Indeed, creating the Fletcher-Munson Curve may seem like an arduous process.
With modern technology and progress in audiology fields, programs such as Audiograms can aid in constructing these curves more conveniently.
A Guide on Reading and Understanding the Fletcher-Munson Curve
The Fletcher-Munson Curve may seem like a complicated chart with an overlapping maze of lines.
But don’t fret; I’ll guide you through it step by step to read and understand it effortlessly.
Recognize the Axes
Firstly, familiarize yourself with the x-axis and y-axis. On the x-axis, you’ll find frequency (in Hertz), which represents the pitch of sound — low frequencies are on the left side, transitioning towards high frequencies on the right.
On the other hand, the y-axis indicates loudness level (in decibels) — lower loudness levels are at the bottom, increasing upwards.
Understand Each Curve
Each curve stands for a specific phon level, which is a measure of perceived loudness or volume.
Remember that these curves are subjective since they’re based on human auditory perception, and our hearing sensitivity changes according to frequency and listening level.
Drawing Connections
To comprehend how perceived loudness varies with frequency and volume, you can entirely choose a point on any given curve and interpret its meaning.
For example, if we pick a point from 1000 Hz at 60 phons on one of these curves — it implies that a tone at 1000 Hz needs to have an intensity level of 60dB to be perceived as ‘this’ loud.
Compare Frequency Response
To grasp how we hear different frequencies at expected loudness levels – imagine drawing a horizontal line across some phone value (repeat 60 phons), intersecting all curves along its way.
You can then compare various points where this line intersects different contours. The decibel values might vary significantly due to our differential auditory sensitivities to frequency.
As one delves into audio mastering, sound production, or just exploring the science of hearing, understanding phenomena like the Fletcher-Munson Curve is essential.
Once you comprehend how to read and interpret these curves, you become more equipped to present your audio in a way that resonates most accurately with human hearing.
The Fletcher-Munson Curves aren’t just an arcane academic concept or a cool-looking chart; they’re a tool for understanding and manipulating sound in ways that best align with our natural auditory perception.
Also Read: Can We Mix Bass In Stereo? 2025 [Mixing The Kick Drum & Bass]
Utilizing Equal Loudness Curves in Audio Mixing and Mastering
The Fletcher-Munson Curve (equal loudness curves) can significantly improve your audio mixing and mastering results. Here’s how:
- Understanding your Audio Content: First, you need to understand the frequency content of your audio. The curves can help highlight which frequencies are more dominant in our human perception of loudness. For instance, we are more sensitive towards frequencies in the 2 kHz to 4 kHz range.
- Applying EQ based on the Curve: Use an equalizer to adjust various frequencies based on the curve. This will ensure that your listeners all perceive them at an equal volume. For example, due to our sensitivity to higher frequencies, they might need to be muted slightly.
- Volume Levels: Mixing at lower volume levels might cause bass and high ends to appear quieter than they are. The curve suggests that louder sounds are perceived with a flatter frequency response relative to quieter sounds; hence, it is better for mixing.
- Critical Listening: It implies using a critical ear while working with sound mixes. Know what frequencies sound louder at different volumes and then adjust your mixture accordingly while accounting for the listeners’ probable volume level.
- Mastering Decisions: The Fletcher-Munson Curves should also guide mastering decisions, especially when determining final levels for specific frequency bands.
Applying these equal loudness contour considerations when mixing or mastering can significantly boost audio quality.
It helps deliver a balanced mix or ensure that all elements of a track shine through at just about any listening level.
Implications of the Fletcher-Munson Curve
The Fletcher-Munson Curve not only brings an interesting aspect to our understanding of auditory perception but also plays a deterministic role in various domains such as acoustics, electronics, and sound engineering.
Acoustics
The Fletcher-Munson curve is a pivotal tool for room optimization in acoustics, particularly in spaces like recording studios or theatres.
By understanding various frequencies at different loudness levels, acousticians can design these spaces to optimize specific frequencies.
Often, this knowledge of human’s adjusted hearing abilities is used to determine the placement and orientation of speakers for optimal sound output.
For instance, lower-frequency sounds like bass require more power than higher-frequency sounds to be perceived as equally loud.
For this reason, you may observe subwoofers placed differently than tweeters in a studio!
Electronics
When it comes to electronics, mainly while manufacturing audio equipment like headphones or speakers, designers often employ these curves for speaker and amp equalization/tuning.
They aid manufacturers in creating devices that conform to how we hear different frequencies at various volumes.
For example, devices can compensate output for those frequencies that we are less sensitive to so they are heard at a perceived loudness equal to other frequencies.
Sound Engineering
In sound engineering, Fletcher-Munson Curves play an integral role during the recording, mixing, and mastering stages.
Engineers essentially have two roles while using these curves:
- To deliver music that sounds good across all volumes
- To ensure it maintains all its sonic textures irrespective of volume changes
Understanding these curves alerts sound engineers of our ear’s bias towards specific frequency ranges, posing a challenge while equalizing or balancing different elements within a mix.
By shaping our approach towards sound based on this curve, we can create audio experiences that are immersive and true to life irrespective of the different devices or environments we experience them in.
Addressing Fletcher-Munson Curve Challenges and Solutions
Understanding and incorporating the Fletcher-Munson Curve into audio work can present unique challenges due to the complexities involved in human auditory perception. Here are some common issues you might face and their potential solutions:
Difficulty in Assessing Relative Loudness
- Problem: One significant challenge is accurately estimating the relative loudness of different frequencies. Your ears do not perceive every frequency at equal volume, making it difficult to create balanced mixes.
- Solution: A spectral analyzer can provide visual feedback of your mix’s frequency content, allowing for more precise balancing.
Change in Perception at Different Volumes
- Problem: Your perception of specific frequencies changes with volume – a phenomenon known as loudness compensation. As such, your mix could take on a completely different character when played loudly or softly.
- Solution: Listening to your mix at different volumes can help. Use reference tracks and ensure your mixes translate well at various volume levels.
Confusion Regarding Equal Loudness Curves
- Problem: The Fletcher-Munson Curves are often misunderstood as indicating that high and low frequencies should be boosted for ‘accurate’ perception.
- Solution: Remember that equal loudness curves reflect how we hear the sound, not how it should be engineered. They help understand our hearing’s sensitivity to specific frequencies at different volumes.
Varied Perception Among Listeners
- Problem: There are individual differences in hearing abilities among listeners, which doesn’t make it easy for sound engineers to achieve the perfect balance.
- Solution: Sound analysis tools like real-time analyzers (RTA) and audio vectorscopes aid engineers in visually depicting audio signals, enabling them to optimize sounds efficiently.
Preservation of Original Sound Quality
- Problem: Maintaining the original sound quality across different good systems can be challenging due to varied frequency responses.
- Solution: A/B testing with different types of speakers can ensure that sound fidelity is maintained. Using reference monitors to provide a flat frequency response can help preserve the original mix’s quality.
By being aware of these common challenges associated with the Fletcher-Munson Curve, you can leverage efficient solutions, enhancing your understanding and application of this fascinating audio principle.
FAQs About Fletcher-Munson Curve
What does the Fletcher Munson Curve indicate?
The Fletcher-Munson Curve indicates the relationship between the frequency of sound and the perceived loudness by the human ear at different volumes. It demonstrates how our perception of sound varies at different frequencies and levels.
What does an equal loudness curve tell us about human hearing?
An equal loudness curve provides information on how we perceive sounds of different frequencies as being equally loud. It reflects that humans are less sensitive to very low or high frequencies and more sensitive to those in the middle range.
What is the difference between pitch intensity and loudness?
Pitch refers to our auditory system’s perception of sound frequency, while intensity is related to pressure or amplitude. Loudness, on the other hand, is a subjective perception of the power of a sound by a specific listener.
According to the Fletcher-Munson curves, which frequency is human hearing most sensitive to?
According to the Fletcher-Munson curves, human hearing is most sensitive to frequencies around 3-4 kHz.
What does audio quality depend on?
Audio quality heavily depends on bit rate, sample rate, dynamic range, and signal-to-noise ratio. It can also be influenced by equipment used for playback or recording and an individual’s perception.
Conclusion
Insight into the Fletcher-Munson Curves is critical to unlocking more affluent, vibrant listener experiences.
As we move forward, this seminal principle will continue to shape how we design and interact with audio.
Whether it’s producing a chart-topping hit, crafting an immersive soundscape for video games, or designing an acoustically robust concert hall, understanding these curves enriches our sound experiences and even paves the way for future sound explorations.
And so, our journey with frequency and decibels continues, constantly redefined by this fascinating phenomenon known as the Fletcher-Munson Curve.

